The goal of every manufacturer is to increase revenue by improving production efficiency. However, many manufacturers fail to take financial analytics into consideration.
For instance, how efficient is your cash use? Are you using applying profitability ratios to help prioritize your inventory and production?
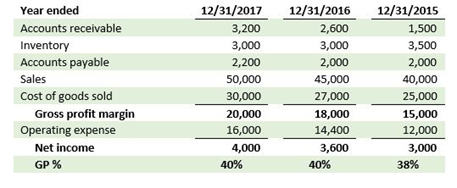
It can be useful to look at what these financial ratios are, and some tools that can help you implement measurements to drive greater efficiency. The following financials will be the basis for the examples outlined in this blog.

Cash Conversion Cycle
The cash conversion cycle (CCC) measures how long it takes to turn your inventory on hand into cash in hand.
Equation: CCC = Days Inventory Outstanding Ratio (DIO) + Days Sales Outstanding Ratio (DSO) – Days Payable Outstanding Ratio (DPO). Let’s first take a closer look at DIO, DSO and DPO.
| DIO |
365 / (Inventory Turnover: cost of sales during period /average inventory balance during the same period) |
This ratio shows how long a company keeps inventory on average before it is sold in days. A smaller number would indicate fast-moving inventory, whereas a larger number could possibly indicate the existence of excess inventory on hand or obsolete inventory, which may not be fit for sale in the current market. This ratio may vary from one industry to another given the nature and lead time of operations.
| DSO |
365 / (credit sales during period /average accounts receivable balance during the same period) |
This ratio shows, on average, the number of days between the sale of goods and when the cash from the sale is available for use. This ratio can be calculated on a customer level as well. A smaller number would indicate that customers that have credit extended to them are quick payers, and therefore great customers. A higher number would indicate slow-paying customers that may turn into delinquent customers.
When evaluating this ratio, consider payment terms that have been set up with credit sales. For example, if your company offers a 30-day payment term, 30 days outstanding could be used as an internal benchmark when evaluating.
| DPO |
365 / (cost of sales during period /average accounts payable balance during the same period) |
This ratio shows, on average, the number of days between the purchase of goods and when the invoice for those goods is paid. As above, payment terms should be considered when evaluating this ratio, except this time it is the credit terms that are extended to your company.
A smaller number as compared to payment terms would indicate that payables are being paid earlier than necessary and therefore negatively affecting cash flow and having lower cash on hand on average. A higher number as compared to payment terms would indicate that it is taking too long to pay creditors. This may hurt relations with creditors and may indicate that discounts for timely payment may be passed up.
(Download Video Transcript)
The overall CCC should be used on a period-to-period basis to compare the overall health of cash flows, and to identify trends that may indicate a need for potential financing to optimize cash flow.
Profitability
Profitability, of course, is the measure of how much more cash is made over how much is spent on production. Ratios associated with profitability include:
| Gross Profit Margin (GPM) |
total sales – cost of sales |
| Gross Profit Percentage (GP%) |
GPM / total sales |
| Turn-and-Earn Index (TEI) |
GP% x inventory turnover |
This ratio, which measures the profitability of inventory items, can be used on a more granular basis, say, by product to determine which products can produce the highest margin the fastest. This ratio could be used to compare products and aid in production priority decisions.
| Gross Margin Return on Investment (GMROI) |
GPM / average inventory during the period |
This ratio can also be used to measure the profitability of inventory items. It will tell you how much profit you are earning on each dollar of inventory, so a ratio of one would indicate that inventory sales have broken even.
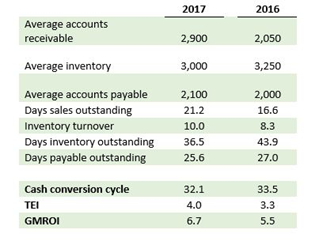
Below is a breakdown of the financial ratios addressed above, based on the financials shared at the top of the blog.

These measurements can be made and evaluated on a period-to-period basis to identify trends, and can also be used for benchmarking in the industry.
© 2017 CPA ContentPlus

