
Published on: Dec 15, 2022 by Nancy Mehlberg, CVB, EA
Updated on: June 25, 2026
| Highlights: |
|
This is the time to be proactive, not reactive, with your business's financial future.
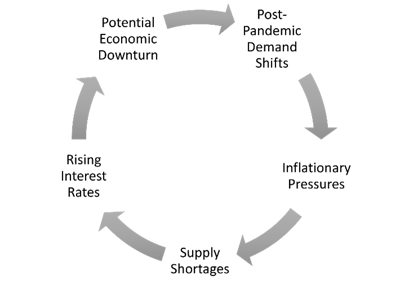
Don't think you can use the model you used in past recessionary periods – this economic climate is much different. Being aware, monitoring, and agility will help you create the flexibility you will need as we progress into the next year.
Read on to learn about forecasting in an inflationary economy, creating budgets with increasing costs and supply chain issues, and key indicators/metrics you should continuously monitor.
A budget outlines expectations of what the company wants to achieve for a particular period, typically one year. It details the direction management wants to take during a specific timeframe. It's broken down by month to monitor and adjust as needed.
A forecast looks at a more extended period, typically five years, and estimates a company's future financial outcomes by examining historical data. A financial forecast examines whether a budget's target will be met or not through the proposed period. It is a report illustrating if the company is reaching its budget goals and where it is heading in the future.
What's the difference? A forecast paints the big picture regarding what the company wants to achieve and the factors involved. A budget is a step-by-step financial plan showing revenue expectations and expenses over time.
Start with a forecast. When you have a realistic financial forecast, you can prepare a budget to meet your goals and make sure both are in alignment. Keep in mind the current factors that will affect your forecast over the next couple of years.
Document your discussions so when you look back you know how you developed each area of the forecast and what you specifically had in mind at the time.
Compare your actual expenses monthly to budgets to see where fluctuations are occurring.
Currently, there is price volatility with increased supply and shipping costs which will impact your budget. Monitor the variances to see if there are other areas you can modify to accommodate increased expenses and maintain your current budget goals.
For larger businesses, develop budgets by product/service line or department. Then make the manager of those groups responsible for reporting on the budgets. It helps keep everyone on the same page and makes leaders accountable for their areas. This may also show which areas of the company are doing well and which may need more attention.
One thing to remember, budgets don't change. Once you set them for the year, they stay static. The actual is where you enter current expenses to calculate variances on each line item.
Once you develop your forecasts and budgets, adjust some factors that you believe may occur to see what impact they have on your financial picture.
If you think cost of goods will go up 20%, make that change and see how much you may need to increase prices or cut other costs to maintain your expected bottom line. You can't predict the future, but you can understand how variables impact your business.
This planning will help you react quickly if variables occur, as you already have the plan to guide you.
While there are many opportunities to consider, here are seven ways to review your supply chain costs to generate some savings:
| 1. Know Your Costs | During the budget process, you will take a deep dive into expenses, which will help you understand where there may be cost volatility. |
| 2. Take Advantage of Discounts | Look at the cost-benefit of the discounts available. Getting an item at a cheaper cost by purchasing in bulk saves you money. However, if the inventory sits on the shelf for long periods, then it isn't a savings in the long run. Your dollars are tied up in products you may not sell or may have to discount to deplete inventory. |
| 3. Focus on Fewer Products | Look at the products with the best margins and consider dropping low-selling products if they aren't core to your business. |
| 4. Stock Core Products | Stock up on products you know you will need so you can meet customer demand. With the volatility in supply chains, just-in-time inventory isn't a great model to rely on currently. |
| 5. Know When to Raise Prices | You need to know when you can absorb costs or when it is the right time to pass it along to customers by increasing prices. Don't wait until you see the financials dip before you increase prices. |
| 6. Increase Delivery Minimums | To maximize the shipping and handling charges you are paying for your raw materials, increase your delivery minimums. |
| 7. Renegotiate Contracts | Where there are more extensive variables, review and renegotiate contracts if possible. |
A KPI is a quantifiable measure used to evaluate the success of an organization in meeting performance objectives. There are financial and operational KPIs.
Once you determine the KPIs you want to measure, you should benchmark them against industry standards, locations, similar companies, etc.
Using KPIs will give you a competitive advantage by identifying the strengths and weaknesses of your company. It will help you know where you need to shore up weaker performance areas.
There are many ratios to choose from, but here are a few to consider. Understand which metrics are essential to your bank and your business operations and measure against the benchmarks you determine are appropriate.
| Gross Profit Margin | Total Revenue less Direct Expenses |
| Profit Margin | Net Income divided by Net Sales |
| Current Ratio | Current Assets divided by Current Liabilities |
| Quick Ratio | Current Assets (less inventory) divided by Current Liabilities |
| Days Receivable | Accounts Receivable divided by Revenue times number of days in a period |
| Profitability | Operating Profit Before Tax divided by Total Income |
| Debt/Equity | Total Liabilities divided by Shareholder Equity |
| Working Capital | Current Assets divided by Current Liabilities |
| Inventory Turnover | Cost of Goods Sold divided by Average Inventory |
| Revenue Growth | (Current Period minus Previous Period) divided by Previous Period → The final answer should be a percent |
| Revenue per Client | Total Revenue divided by Customer Count |
| Client Retention Rate |
|
A break-even analysis is defined as the total amount of sales needed to cover your overhead costs, using your average gross profit.
You can break this down by unit of sale, so you know how many units need to be sold to break even. Then you know how much revenue you will generate for each sale over that minimum.
This applies to service industries as well. You can calculate how many adjustments a chiropractor needs to schedule per day to cover the costs for that day. This is a great tool to use for bonuses.
For example, if you know you need to sell five units per day, you can incentivize your sales team when you go over that goal. Using a break-even analysis spreadsheet makes it easy to calculate the impact of increased sales on high-dollar items.
Here are a couple of simple calculations to help you determine your break-even points:
| Break-Even Point (units) | Fixed Costs / (Revenue per unit - Variable cost per unit) |
| Break-Even Point (sales dollars) | Fixed Costs / Contribution margin (Contribution margin = Price of the product minus Variable costs) |
This is a generally high-level view of things to consider right now. Talk with your management team and your accountant to determine how you should use budget, forecasts, and metrics to drive your business decisions.

Share this post:
Nancy is a Principal with SVA Certified Public Accountants and helps clients improve their company profitability and protects their interests by clearly understanding their future goals. She works closely and proactively with clients with an emphasis in business and income tax planning and financial reporting.
Get Weekly Biz Tips Delivered Straight to Your Inbox!


Madison, WI
1221 John Q Hammons Dr, Suite 100
Madison, WI 53717
(608) 831-8181
Milwaukee, WI
18650 W. Corporate Drive, Suite 200
Brookfield, WI 53045
(262) 641-6888
Colorado Springs, CO
10855 Hidden Pool Heights, Suite 340
Colorado Springs, CO 80908
(719) 413-5551


Copyright © 2026 SVA Certified Public Accountants | Privacy Policy | Cookie Policy | CCPA