
Published on: Dec 07, 2022 by Craig Maternowski, CPA
Updated on: January 29, 2026
| Highlights: |
|
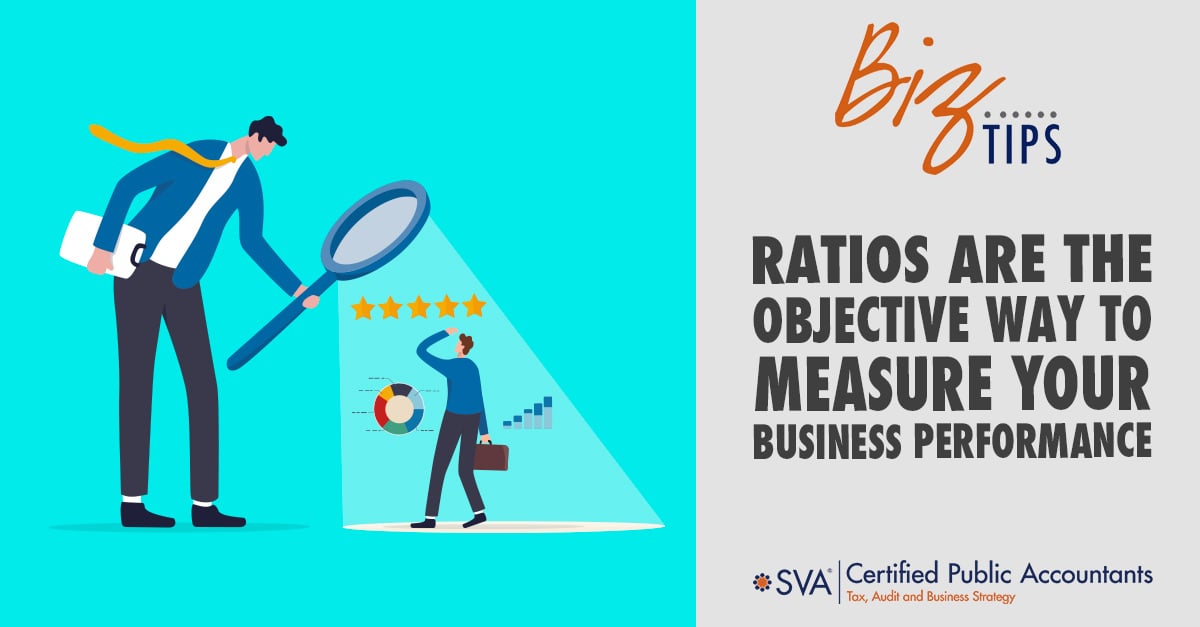
Financial ratios provide an objective way to measure your company’s performance.
Using the information on your financial statements, you can easily calculate various ratios and create a financial ratio analysis that gives you insights into performance over time, comparisons to competition, and helps you measure against internal goals.
| Profitability Ratios | Indicate the financial viability of your business. They demonstrate how your company is generating profits from your operations. |
| Liquidity Ratios | Convey your company's ability to pay off its debt. |
| Solvency Ratios | Compare debt level with assets, equity, and earnings, which evaluate how solvent the company is. |
| Efficiency Ratios | Convey the use of assets and liabilities to generate sales and create profits. |
Consistent measuring is imperative in long-term decision-making.
Ratios can easily be measured to compare performance over time and to compare with similar industry standards. They will help you gain an understanding of where your company has been and where it could go over time.
Benchmarks can be created based on industry standards for like company structures.
Start by selecting the ratios that best suit your needs, and be careful to watch for seasonality influences. Measure your chosen ratios monthly, quarterly, and yearly, and then compare them to see the whole picture, enabling you to create goals based on performance.
For example, you might be pleased that your revenue has increased over the years, but you may have a negative gross profit margin or a decrease in liquidity that is a more accurate representation of your company's financial health.
| Accounts Receivable Turnover | |
| This ratio measures how your company is managing collections | |
| Formula | How To Analyze |
| Net Annual Credit Sales / Average Accounts Receivable | A higher rate means your customers are paying their bills quickly |
| Current Ratio | |
| This liquidity ratio provides stakeholders with information regarding a company's ability to meet its short-term financial obligations. It is used by creditors and lenders when credit needs to be extended. | |
| Formula | How To Analyze |
| Current Assets / Current Liabilities | The higher the ratio, the more likely the company can timely pay off its obligations. |
| Cash Flow Margin | |
| This ratio helps show the relationship between cash generated by operations and sales. It is a trusted metric of a company's profitability and efficiency, as well as earnings quality. | |
| Formula | How To Analyze |
| Operating Cash Flow / Net Sales | The higher the percentage, the more ability you have to convert sales to cash flow. |
| Days Payable Outstanding (DPO) | |
| This ratio indicates how well the company is managing cash flow. It shows the average time it takes to pay bills and invoices to creditors. | |
| Formula | How To Analyze |
|
Days Payable Outstanding = Average Accounts Payable / Cost of Goods Sold x Number of Days in the Accounting Period Average Accounts Payable = Accounts Payable Balance at the Beginning of the Period - Ending Accounts Payable Balance / 2 |
A higher DPO indicates a longer time to pay bills, which can be advantageous if the company is using the funds until they are due to creditors. However, a high DPO could also be a red flag that the company is unable to pay bills on time. |
| Debt Service Ratio | |
| This ratio indicates the ability to repay all debt obligations with operating income. Debt ratios indicate solvency as it measures total liabilities as a percentage of total assets. Essentially, this ratio indicates the ability to pay off liabilities with assets. | |
| Formula | How To Analyze |
| Total Debt / Total Assets | A lower debt ratio indicates a more stable business. Each industry has its own benchmarks for debt, but .5 is considered reasonable as it indicates that the liabilities are only 50% of total assets. This means that creditors only own half of the company assets and the shareholders own the other half. |
| Gross Profit Margin | |
| Indicates how much of your revenue is profit after expenses are subtracted. It should be large enough to cover your fixed (operating) expenses. This is an indicator of how good a company is at creating a service compared to the competition. | |
| Formula | How To Analyze |
| Net Sales - Cost of Goods Sold / Net Sales | Without an adequate gross margin, a company cannot pay for its operating expenses. In general, a company's gross profit margin should be stable unless there have been changes to the company's business model. |
| Inventory Turnover Ratio | |
| This ratio is a measure of how the company is generating sales from their inventory. | |
| Formula | How To Analyze |
| Cost of Goods Sold / Average Inventory | A high turnover rate could indicate an inadequate inventory level, resulting in stock shortages. A low turnover rate may indicate overstocking. |
| Liquidity Ratio | |
| This ratio indicates the company's ability to repay short-term creditors with available cash. | |
| Formula | How To Analyze |
| Liquid Assets / Short-Term Liabilities | If the ratio is greater than 1.0, your cash on hand will cover the short-term liabilities. |
| Net Profit Margin | |
| The percentage of revenue left after all expenses have been deducted from sales. The measurement reveals the amount of profit that a business can extract from its total sales. The net sales part of the equation is gross sales minus all sales deductions, such as sales allowances. | |
| Formula | How To Analyze |
| Net Profit / Net Sales | A high net profit margin indicates that a business is pricing its products correctly and exercising good cost control. Generally, a net profit margin in excess of 10% is considered excellent, though it depends on the industry and the structure of the business. |
| Operating Margin | |
| This ratio measures how profitable the company is from its operations. | |
| Formula | How To Analyze |
| Operating Income / Revenue | If your operating margin is 0.5, it indicates that there is $0.50 in profit for every dollar of revenue. This ratio does not account for non-operational expenses; it should not be used alone. |
| Quick Ratio | |
| The quick ratio measures the ability to use quick assets to cover current liabilities. | |
| Formula | How To Analyze |
| (Cash and Cash Equivalents = Marketable Securities + Accounts Receivable) / Current Liabilities | A company with a ratio less than 1.0 cannot quickly pay back its current liabilities. |
| Return on Total Assets | |
| This ratio shows the company's net profit in relation to its assets value. | |
| Formula | How To Analyze |
| Net Income / Average Total Assets | The ratio is often used by financial institutions when considering a loan for your company. It indicates how effectively the company uses the money to secure assets. |
As you can see, there is a lot to measure, so work with your trusted advisor to establish a consistent financial ratio analysis process for your company.

© 2022 SVA Certified Public Accountants
Share this post:
Craig is a Principal with SVA Certified Public Accountants and works closely with business owners and their management teams to advise them on accounting and tax issues.
Get Weekly Biz Tips Delivered Straight to Your Inbox!


Madison, WI
1221 John Q Hammons Dr, Suite 100
Madison, WI 53717
(608) 831-8181
Milwaukee, WI
18650 W. Corporate Drive, Suite 200
Brookfield, WI 53045
(262) 641-6888
Colorado Springs, CO
10855 Hidden Pool Heights, Suite 340
Colorado Springs, CO 80908
(719) 413-5551


Copyright © 2026 SVA Certified Public Accountants | Privacy Policy | Cookie Policy | CCPA